In 1990, 32 years ago, on the heels of more than a decade of global warming, CO2 was convicted, on the basis of conjecture and circumstantial evidence, as being “guilty”1 of causing the relatively high rate of global warming being experienced during the last decade. Worldwide, calls to cut CO2 emissions began. The calls spread and intensified and an obsession with “carbon footprint” and “climate change” ensued. Despite no verification of the claim, no compelling evidence to support a CO2 conviction, and a blind eye turned to the previous 34-year period of global cooling while CO2 emissions quadrupled, billions of dollars were spent, millions of jobs were created, thousands of articles written, legions of activists emerged and 27 international conferences were held, all devoted to cutting CO2 emissions. Did all of that effort result in reduced CO2 emissions?
Surprise! The answer is: NO, not at all! CO2 emissions grew worldwide. Substantially!
Also surprisingly, despite ever-increasing annual CO2 emissions and much higher atmospheric CO2, the global warming rate moderated after the 1979-1998 period of high global warming. Here are the relevant facts and information.
From 1990 to 2021 annual worldwide energy and industrial CO2 emissions increased by 157% from 21.4 to 36.3 billion tonnes/year2. And 800 billion tonnes of CO2 emissions were added to the atmosphere over the period. The CO2 atmospheric concentration rose from 0.000354 to 0.000416, that is from 354ppm to 416ppm3. Many countries doubled their CO2 emissions, and China’s CO2 emissions rose by 430%, (1990 to 2018). The United States, however had lower CO2 emissions in 2021 than in 19904. All the exhortations, energy and money put into cutting CO2 emissions was futile. Should, we be worried? No! Not about the CO2 anyway. Here are what the actual data and facts reveal.
FACTS: (1) We are in an interglacial period of global warming that began about 1750, (end: Little Ice Age Period and start: Current Warm Period). (2) Fossil fuels do pollute the air with particulates, CO, NO2, and SO2 and more. (3) CO2 is not a pollutant, it is what we exhale, it is what plants take in to grow and it is a minor, but critically important greenhouse gas. At its low atmospheric concentrations (<250 ppm) it is essential for plant growth and for warming that makes the planet habitable. However, amazingly, this miracle molecule’s greenhouse effect asymptotically decreases so as to produce little added warming as its atmospheric concentration (ppm) goes higher4. (4) A review of the readily available empirical evidence, NASA5, post 1850, clearly reveals that CO2 emissions were, “not guilty” of causing the global warming. Thus, CO2 can now justly, and fairly be exonerated to continue its important job of fostering plant life. OPINION: The prosecutors of CO2, for 32 years mocked dissent, and suppressed the evidence. The defense was excluded and denied a voice. Two of the key pieces of evidence for acquittal, is as follows:
From 1929 to 1944 when CO2 emissions were minor, and the atmospheric concentration of CO2 was low (307-310 ppm), global temperatures rose at a rate of +0.370C/decade3. This 1929-1944 warming rate was greater than the (+0.320C/decade) rate that occurred from 1976-1998, during the next episode of high global warming, 50 years later. Even though CO2 emissions in the 1979-1998 period were 4.5 times greater than in the 1929-1944 period and the atmospheric concentration of CO2 was considerably higher (332-367ppm). The later episode, although with a lesser warming rate than the earlier interval, spawned the 1990 Global Warming “alarm” and its hasty link to CO2 emissions that led to the UN’s call for CO2 emission’s reduction and now for their eradication.
Remarkably, global temperatures were lower for an extended period after 1944 and stayed below the 1944 level until 1979. This cooler period occurred despite CO2 emissions increasing 4-fold, from 5 to 20 billion tonnes / year and the atmospheric concentration of CO2 rising to 337ppm. The max drop in temperature from the 1944 level was -0.40C, in 1964. The lower temperatures lasted for 34 years during the time CO2 emissions were accelerating post WWII. Clearly, refuting the alleged correlation between CO2 emissions and global warming that was the cornerstone of its prosecution in 1990.
This readily available historical evidence, that was missed or intentionally overlooked in the rush to judgement of CO2 emissions in 1990, clearly illustrates that climate influencing factors, other than CO2 emissions, drove global warming post 1850, as they had since 1750. Indeed, these factors have been affecting global temperatures and climate for millennia. This very relevant global temperature history and its relationship to CO2 emissions was and still is ignored by those pushing CO2 emissions culpability. Global temperature changes during our current + 15,000-year interglacial period shows similar periods of warming (e.g. Roman Warm Period, Medieval Warm Period), followed by periods of cooling (e.g. Little Ice Age) since the last glaciation.
Post 1998 empirical evidence also exonerates CO2 emissions. In 1998 CO2 emissions were 23.4 billion tonnes/yr. They reached 33.5 billion tonnes/yr. by 2011, and atmospheric CO2 reached 392ppm. If CO2 were to blame for global warming, then temperatures should have continued to rise and at an increasing rate. But over that 13-year period (1998-2011) global temperatures were flat. NASA’s 2011 reading5 matched that of 1998 and 5 of the 13 years had temperatures lower than 1998’s. The UAH satellite lower atmosphere data showed lower temperatures for 16 years. These data further demonstrate that CO2 emissions are not driving global warming.
Conclusion –After 32 years the IPCC and CO2 “climate change” promoters have lost their credibility! There has been no actual evidence produced that shows reducing CO2 emissions will have any significant impact on reducing global temperatures, so all the current efforts are a fool’s errand. Mathematical models with subjective inputs do not serve as evidence.
The massive undertaking to reduce CO2 emissions has been a dismal flop, mathematical climate model projections have been routinely overstated, there was no apparent effort to verify, or investigate the original CO2 culpability hypothesis nor to monitor and adjust to observations of the ongoing data (e.g. a trillion tonnes of emissions have been added since 1979 with no increase in the overall global warming rate), and lacking any progress, the latest tactic of the IPCC is to instill fear of planetary demise in the population as a means to maintain status and control.
The fixation on CO2 emissions should be dropped and efforts should be refocused on addressing what actions can be taken to deal with the effects of global warming (e.g., locally rising sea levels) till the end of this interglacial warming period, and on making green energy alternatives environmentally sound safe and economically competitive in order to legitimately reduce fossil fuel consumption.
References
1 IPCC First Assessment Report, en.wikipedia.org/wiki/IPCC_First_Assessment_Report
5 CO2 Coalition, Fact #2, The warming effect of each molecule of CO2 declines as its concentration Increases, co2coalition.org/facts, Facts Archive – CO2 Coalition
6 Global Temperature, NASA, Global Land-Ocean Temperature Index, climate.nasa.gov/climate_resources/127/global-temperature/
A paradigm is a widely accepted belief or concept based on a set of assumptions. The current global warming (climate change) paradigm in the United States, persistently aired by the media, relentlessly pushed by progressive politicians (recently by President Biden), pervasively taught in public schools and universities and accepted as reality by many in the United States, is the belief, primarily based on assumptions and climate model projections using subjective inputs, that:
(1) The United States, by sharply decreasing its CO2 emissions, will avert an existential climate crisis.
Imbedded in and forming the basis of this paradigm are two other paradigms, also based on assumptions, not verified by facts, that are widely accepted as true, are:
(2) That CO2 is the main / primary driver of the global warming currently being experienced and,
(3) That reducing / cutting / eliminating human produced CO2 emissions will control / eliminate the global warming being experienced.
A “Paradigm Shift” occurs when one gains knowledge and factual information that invalidates the assumptions of the existing paradigm. One of the most famous paradigm shifts resulted from Copernicus’s findings, based on his astronomical calculations, that the Earth revolved around the Sun rather than the widely accepted belief in his time, that the Sun revolved around the Earth. Copernicus’s work and the factual proof was not published until he was on his deathbed because he was afraid of the potential consequences. Even then his book was banned by the Catholic church and remained banned for almost three hundred years before the “incorrect paradigm” was shifted to the truth. We do not have three hundred years to shift the above paradigms. Debilitating policies based on these invalid assumptions are already in the works and severely cripplingly climate change “mandates” could be imposed in the near future.
We, the American people, as well as the rest of the world, urgently need to experience paradigm shifts that will prevent potential devastating consequences that would result from the impending formulation, imposition and enforcement of ill founded, misguided polices, restrictions and controls on CO2 emissions. Readily available facts* and information clearly refute each of the existing paradigms cited above.
*on Wikipedia for example
First Paradigm to shift
Let’s examine the first paradigm in need of shifting – i.e. – The general belief of the populous – based on statements, assertions, and declarations from the IPCC, the main stream media, environmental groups and most recently by the United States Government, that: —–The United States by drastically cutting its CO2 emissions will avert an existential climate crisis. (Biden’s announced plan is to cut United States CO2 emissions by 50-52% of their 2005 levels by 2030.)
Yes, there is ongoing global warming. The current, interglacial, cycle of warming began around 1750 when global temperatures of the “Little Ice Age” reached their minimums. Yes, the burning of fossil fuels pollutes the air, putting carbon monoxide, nitrogen dioxide, sulfur dioxide, and hydrocarbon particulates in the air. And the oceans are being fouled with plastic waste. Some actions to address these realities have been taken but more can and should be done. However, these environmental needs are barely attended to with all the attention on reducing CO2 emissions.
But, is it true that — drastically cutting United States CO2 emissions will really avert a climate crisis? Here are some relevant facts and information that answer that question and hopefully can, with broad dissemination, nationally shift this first paradigm which focuses on the United States response and ability to allay the purported climate crisis.
(1) In 2018, the US produced 14% of the total annual worldwide CO2 emissions, a total of 4,800 MMT (million metric tons). The US has been cutting their CO2 emissions since 2000. The United States now emits less CO2 than it did in 1990, when calls for CO2 reduction began. The use of natural gas in lieu of coal has made the greatest contribution to this reduction in United States CO2 emissions.
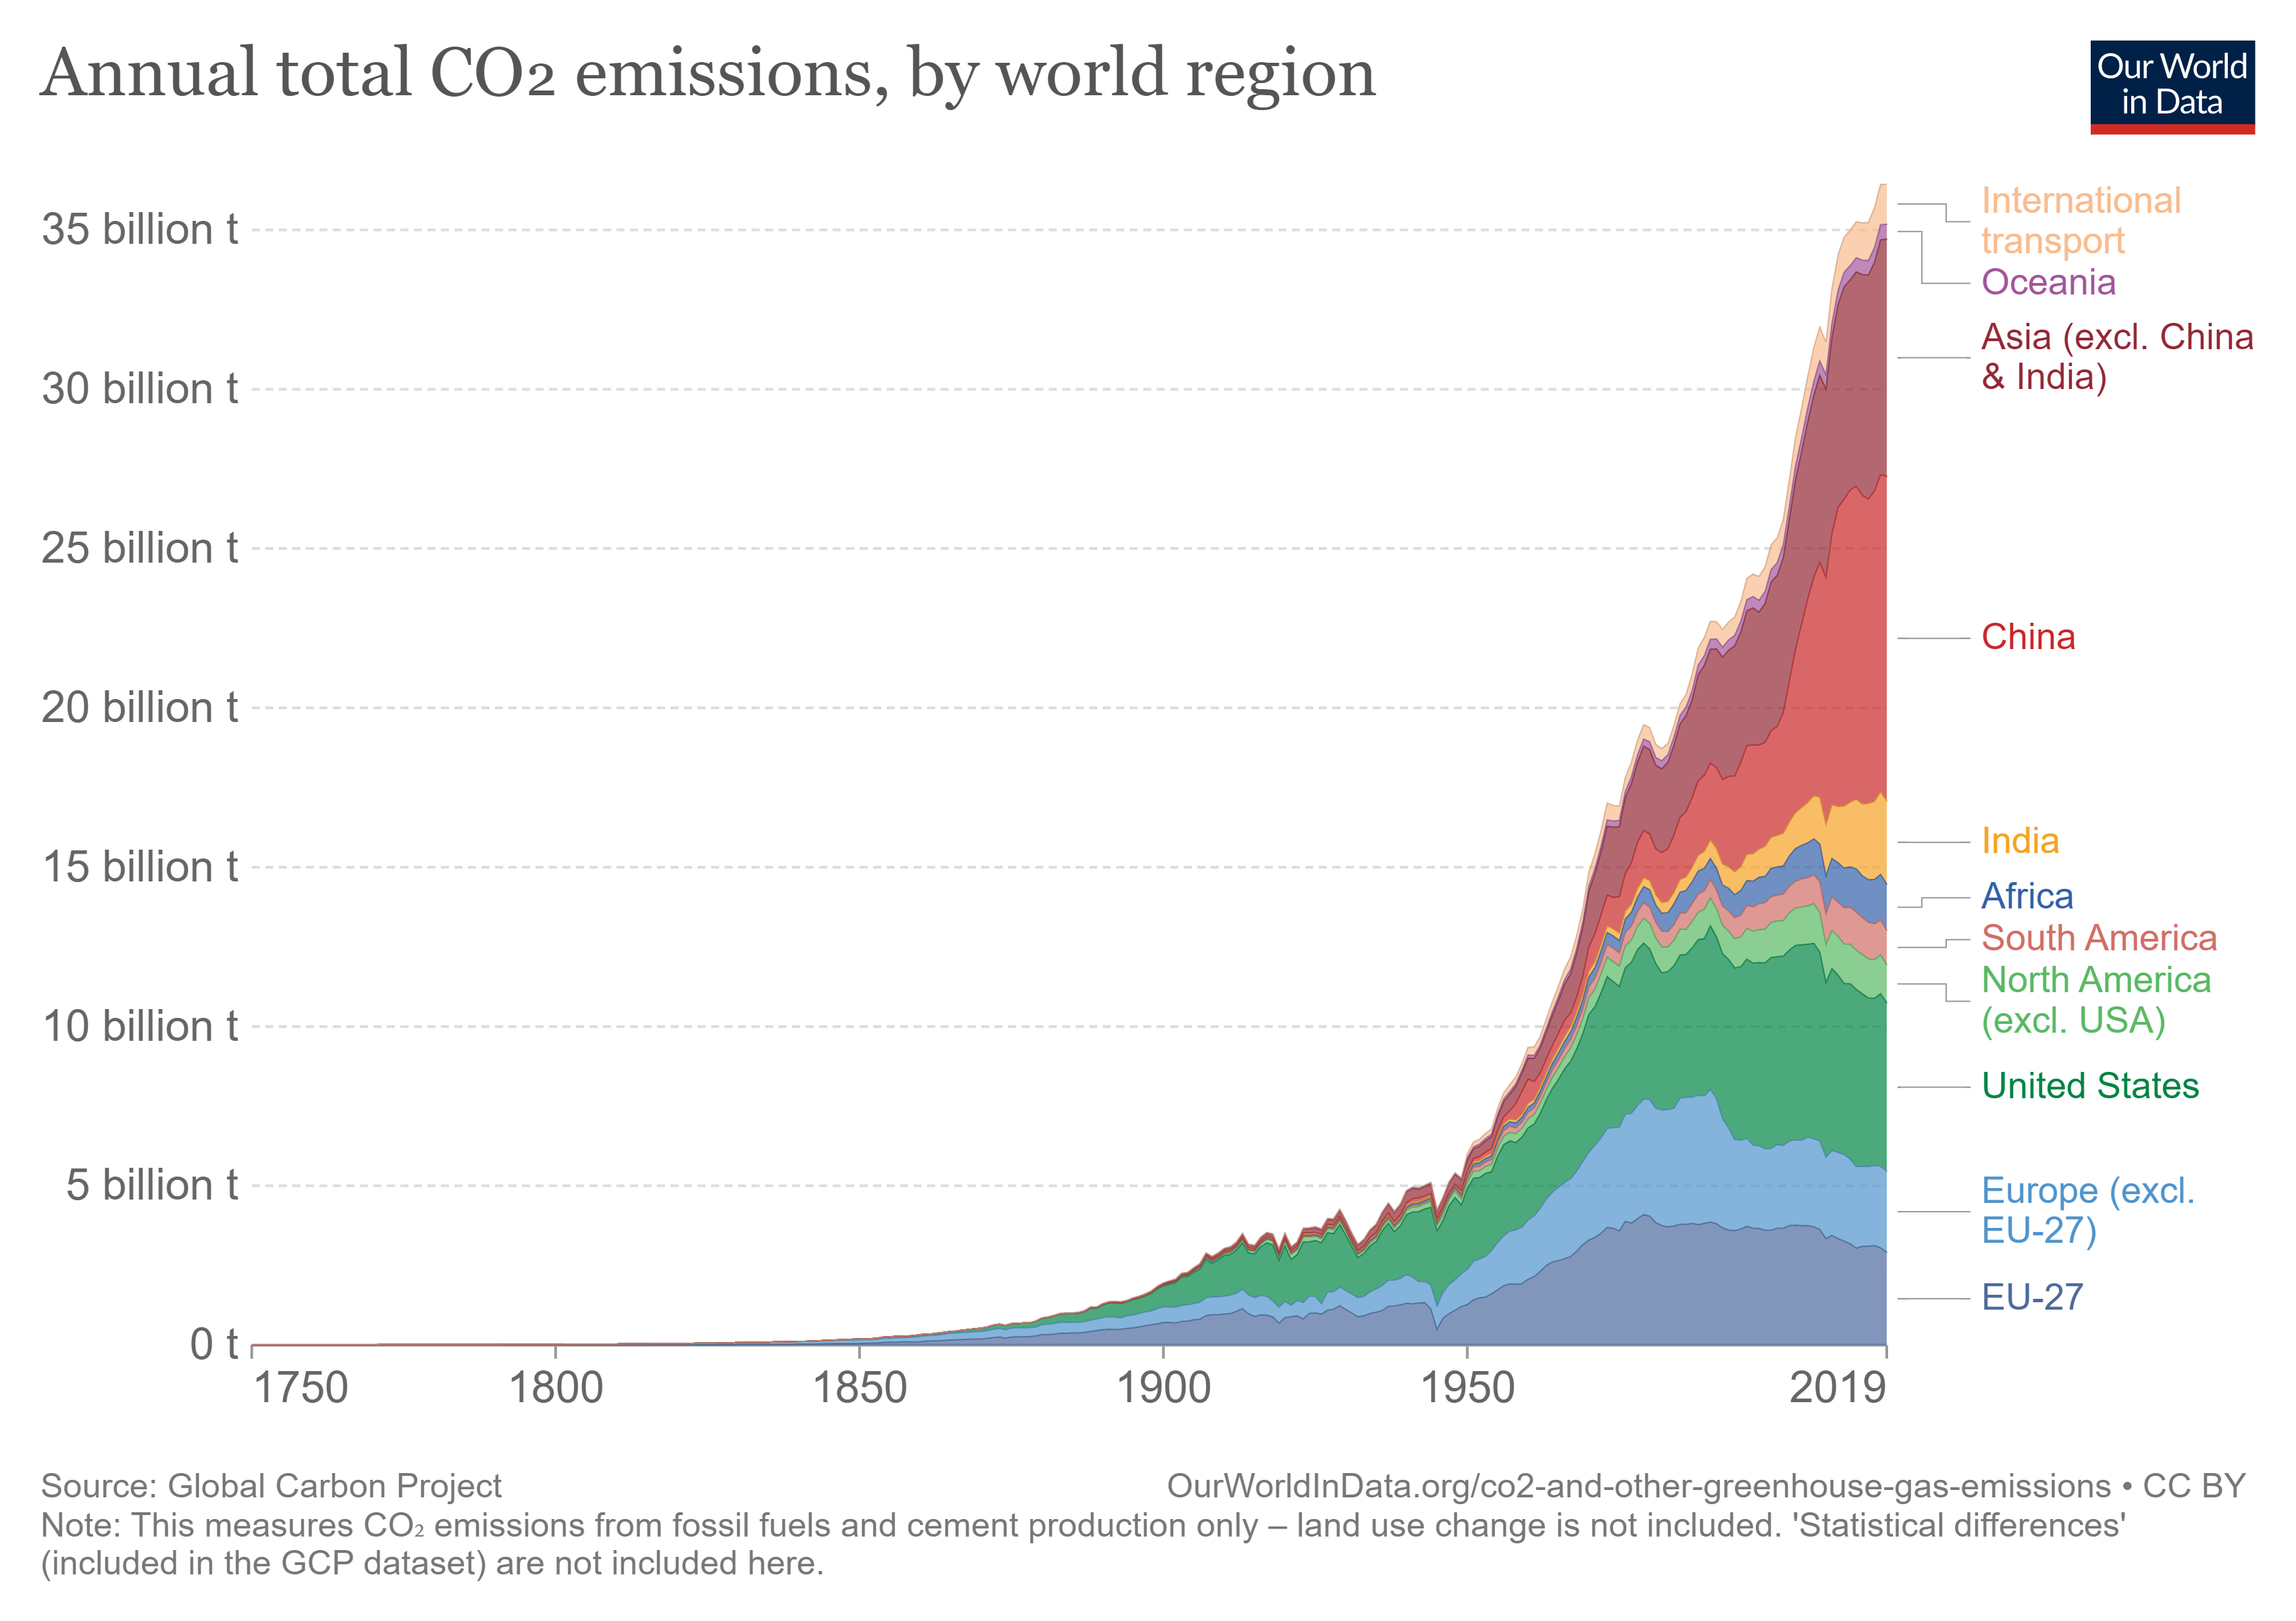
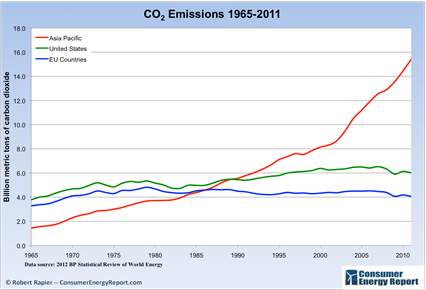
(2) But, while the US has been cutting CO2 emissions, most countries since 1990 (see Figure 1) have been steadily increasing their CO2 emissions, some greatly so. For example, China’s CO2 emissions rose from 2,397MT to 10,313MT (1990 to 2018), a 430% increase. China’s per capita CO2 emissions also grew, increasing by 533% from 1980 to 2018. As can be seen by examining the graph , most countries (other than the US and the EU) have roughly doubled their emissions. Developing countries, as expected, are just beginning to ramp up their CO2 emissions.
(3) In contrast to China and most other countries, the US and the EU have cut per capita emissions. US per capita CO2 emissions have declined by 22.5% since 1980.
(4) From an overall outlook, that really puts the situation in perspective, worldwide annual CO2 emissions from 1990 to 2018 increased 164%, (from 22,000 MMT to 36,000 MMT). The US did not contribute at all to that 164% increase, actually, the US helped it from being an even greater increase. Most importantly, with respect to the implication of the “critical role” and importance attached to what the US must do, is that: Even if the US had produced zero CO2 emissions in 2018, there still would have been a worldwide increase of 141% in carbon dioxide emissions between 1990 and 2018.** So it is evident that:
What the US has done to cut carbon dioxide emissions (emissions in 2018 were cut by 20% over 2005 levels), is continuing to do (the United States achieved the largest absolute reduction in carbon dioxide emissions of any country in 2019 – IEA), and is being tasked to do over the next 8 years (meet the objective of a 50-52% cut in emissions by 2030) would hardly make a ripple in the essentially unabated, continuing increase in world-wide carbon dioxide emissions. The steady increase in worldwide CO2 emissions is clearly displayed in Figure 1.
Figure 1 – CO2 Emissions by Major Economies and by Region, Source –Our World in Data
**(An example of the fallacy, and inconsistency in implying that US actions are able to reduce overall global CO2 emissions was the Biden Administration’s shutting down the US Keystone pipeline construction, ostensibly to reduce fossil fuel consumption, and then (1) lifting the sanctions on the Nord Stream 2 Russian oil pipeline delivering oil to Germany and (2) asking OPEC to increase its oil production to help reduce gas prices (that immediately rose when the US Keystone pipeline was shut down).
So as is evident from Figure 1 and the statistics presented above, that:
Despite the IPCC warnings to reduce CO2 emissions since 1990 – AND
Despite the periodic “climate accords” among nations,
The annual rate of increase of CO2 emissions has essentially continued unabated.
So, if indeed CO2 emissions presented an existential threat to the planet, the pleas and plans for the United States to drastically reduce CO2 emissions would not even come close to dealing with that threat.
Thus, the looming plans to impose CO2 emission restrictions on the people of the United States and the impassioned pleas for cutting US CO2 emissions based on fears of a doomed planet and our children’s futures, with inference that such cuts, by the people of the United States, will avert a climate crisis, are disingenuous, misleading, and raise false hopes. It is clear from the data and from the evident lack of worldwide response that such actions would be unproductive and ineffective and would uselessly impose great suffering and undue burdens on Americans. It is evident that this first paradigm: “The United States, by drastically cutting CO2, will avert a climate crisis.”, should “shift” to the now informed understanding that ifindeed CO2 emissions were producing global warming and an impending crisis:
The NEW PADIGIGM should be:
Imposing harsh CO2 emission controls on the US would not avert a “climate crisis” even if the US cut its CO2 emissions to zero.,
So, the answer to the question: Will drastically cutting United States CO2 emissions really avert a climate crisis?” is NO IT WON’T !!!, because based on the evidence, the rest of the world’s CO2 emissions will continue to rise more than making up for the US declining contribution. For example, China plans on continuing to increase emissions, (ostensibly reaching a peak in 2030), and developing countries, [i.e. in Africa, etc.] are in the CO2 emissions expansion stage as would be expected as they are indeed “developing” countries.
The above paradigm shift does not implythat we should stop reducing our fossil fuel emissions, because they indeed produce air pollution. The US action to reduce emissions has been great and helps set an example to the world. The point is to correct the widely held misconception that our (the US ) actions can effect a “substantive change” and to avoid imposition of draconic measures in the US to achieve that alleged change.
Does it seem hopeless? Will worldwide CO2 emissions result in fulfilling the claimed “existential threat” (of ending our very existence). Good News! – It isn’t hopeless. Because that emphasized if, indicated above, is a really big IF. Recall there are two more Paradigms to shift, namely:
(2) That CO2 is a main/primary driver of the global warming being experienced and,
(3) That reducing / cutting / eliminating CO2 emissions will control / eliminate global warming.
Second Paradigm to Shift
The examination of the second paradigm uses the actual empirical global temperature data record and the record of C02 emissions over more than 100 years. These data are readily available and provide the basis for shifting the second paradigm. Simply by juxtaposing the NASA global temperature data and the CO2 emissions data since 1880, clearly illustrates that CO2 is not the main driver of global warming. These data, as explained below, refute Paradigm 2 and the corollary to that finding refutes Paradigm 3, (i.e. if CO2 emissions are not the primary cause of global warming, eliminating them will not stop the currently ongoing global warming cycle that began in 1750 (as the natural variation will still be controlling). Here are the key, relevant graphs of empirical data that allow Paradigm 2 to be refuted.
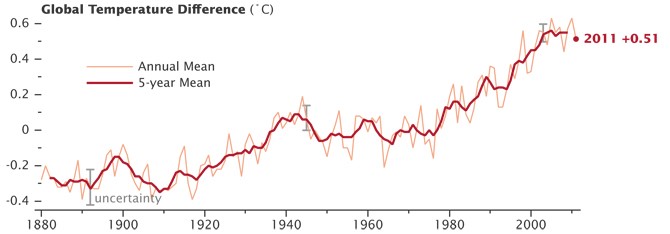
Figure 2 – NASA global surface temperature data plot– (NASA Headquarters release No. 12-020 – now archived)
Figure 3 – Global Carbon Dioxide Emissions, 1850–2030 – Source – Center for Climate and Energy
It can be seen in Figure 3 that annual worldwide CO2 emissions slowly and gradually increased from 1850 to around 1945. They started to rise sharply around 1945. Since then, the annual rate of increase has essentially continued at nearly the same rate of rise. Interestingly, and very relevant with respect to determining whether CO2 drives global warming, Figure 2 shows that beginning about 1945 and continuing through 1978, precisely the period that CO2 emissions were rapidly increasing, global temperatures decreased. There was no increase in global warming due to that significant and rapid rise in annual CO2 emissions and the attendant atmospheric accumulation that resulted from them. That is the science! The real empirical, factual, science that has been ignored by the climate alarmists. Global temperatures over the entire period from 1945-1978 were lower than they were in 1944 despite sharply, continuously increasing CO2 emissions. Global cooling, rather than global warming, occurred during a 4-fold increase in annual carbon emissions, from 5000 MMT to 20,000 MMT during that period. Natural climate / temperature controlling parameters, other than CO2 emissions, produced this 34-year period of lower global temperatures, just as they had produced lower global temperatures from roughly 1900 to 1910 (see figure 2) and higher temperatures (global warming) from 1917 to 1944.
Now, as can be seen in figures 2 and 3, around 1979 global temperatures began to rise above the 1944 level while CO2 emissions continued to increase at roughly the same annual rate. Global temperatures increased relatively rapidly post 1978. So it can be seen that there were two periods (1944-1978) and (1979-1998) with similarly increasing carbon emission rates, but two distinctly different global temperature responses. However, the post 1979 increase was attributed to the CO2 emissions, essentially on the basis that both temperature and emissions were increasing concurrently and that CO2 is a greenhouse gas (albeit a minor one). The previous period during which the opposite effect was observed is overlooked or intentionally ignored in attributing the post 1979 global warming to the effect of CO2 emissions.
There is more empirical data evident in these graphs to clearly discredit the CO2 emissions / global warming correlation. Look at the period 1917 to 1944 on each graph compared to the period 1979 to 1998. The data reveal another empirical record comparison which refutes the correlation of CO2 emissions with global temperature rise. During the period 1917 to 1944, carbon emissions were quite low. Emissions were yet to be significant and were undergoing little change from year to year. By contrast global temperatures rose sharply during that period. In fact, the annual rate of global temperature rise during that period (1917-1944 -see Table 1), with small carbon dioxide emissions, matches the rate of global temperature rise experienced during the 1979 to 1998 period. The latter period experienced 5 times greater annual carbon dioxide emissions. Two time periods, experiencing extremely different CO2 annual emissions as well as atmospheric CO2 concentrations, having nearly identical global warming rates of rise, clearly discredits a finding of any significant influence of CO2 emissions and supports the concept that the natural variations producing warming were apparently similar and were controlling. Notably, the rate of rise in global temperatures post 1979 (which as was shown is similar to the post 1917 rate of rise) was an important contributing factor to the global warming CO2 emissions “alarm” raised post 1979 on the heels of the “global cooling” predictions and alarms that were sounded just a few years prior.
Table 1 – Change in global warming vs cumulative amount of CO2 emitted (1917-2015) in Million Metric Tons -MMT
Period CO2 emitted CO2 emitted in Accumulated CO2 Temp. change Temp. rise /
Annually – MMT the period MMT emissions MMT + or – year
1917-1944 3,500 -5000 114,750 114,750 + 0.68 deg C +0.025
1944-1979 5,000-20,000 287,500 402,205 – 0.05 deg C
1979-1998 20,000-24,000 462,000 864,205 + 0.47 deg C +0.025
1998-2013 24,000-32,000 420,000 1,284,000 – 0.06 deg C
1998 -2015 24,000-32,000 476,000 1,350,000 – 0.30 deg C UAH satellite data
The conclusion, based on the actual empirical data presented above, which shows no consistent, discernable correlation between annual CO2 emissions and global temperatures, is very clear, namely that the current second paradigm that “CO2 is driving global warming and climate change”, should undergo a Paradigm Shift to: New Second Paradigm:
********** CO2 is not a main driver of the global warming currently being experienced. ***********
The atmospheric concentration of CO2 is believed to be critically important in warming the planet, up to an atmospheric concentration of CO2 of about 180 ppm. It is a fact that CO2 is a greenhouse gas and thus it makes sense that some contribution to global warming is ongoing from the great increase in CO2 emissions. However, at the larger concentrations existing in the atmosphere from 1880 to the present (approximately 280 ppm to currently 415 ppm) the contribution to Global Warming from CO2 is not able to be successfully discerned when the empirical global temperature data record is juxtaposed with CO2 emissions. Because global temperatures were warming post 1979 and carbon emissions were continuing to steadily rise, the IPCC and others assumed a direct correlation and selectively used the empirical records post the late 1970’s to illustrate a direct correlation and an assumed causation between CO2 emissions and global warming. They evidently essentially ignored the previous years with substantial evidence of the absence of correlation and causation.
Third Paradigm to Shift
There are 3 considerations that illustrate that the third “current paradigm”, which is that “cutting / eliminating CO2 emissions will control/eliminate global warming”, is an invalid assumption. While this paradigm is prolific in its proclamation and promotion, with literally thousands of people studying about, writing about and taking steps to try to fulfill its pledge, this paradigm is actually an empty promise, an assumption/supposition not supported by any material, demonstrative evidence. It is an assumption that, on a global scale, is untested, and unproven. It remains an unverified conjecture, devoid of experimental or experiential basis or any empirical global temperature data to support its postulation.
The following three considerations rebut the third paradigm’s validity and expose its foundational weaknesses.
The fundamental rebuttal, as illustrated by the data presented above that refuted Paradigm 2, is this: “Because CO2 is not a main, or even a discernable driver of the global warming being experienced, then cutting / eliminating CO2 emissions would likewise not be able to control, substantially reduce or eliminate global warming”.
Figure 3 shows that CO2 annual emissions have been on the rise since 1850 and that they began increasing substantially after 1950. Thus, since 1850 there has never been a period of time to observe / quantify what the global effect of cutting or lowering CO2 emissions has been or would be. Further, not only have annual CO2 emissions increased year over year, the portion of the CO2 emissions that reach the atmosphere, (roughly 40-60%), stay for very long periods of time (10s to 100s of years), thus CO2 emissions have produced a gradual, continuous build-up of atmospheric concentrations of CO2 since 1850. So, there has been no opportunity to scientifically measure, test or quantify the hypothesis that “cutting / eliminating CO2 emissions will control/eliminate global warming”. Therefore, there has been no material scientific evidence or confirmation that could show the degree to which global temperatures would decrease if CO2 emissions are cut or are eliminated or even to establish that any decrease at all could be discerned. However, since the empirical data, as a whole, over the period 1880 to present, are not able to show a discernable or repeatable effect on the rate of increase in global temperate rise as a function of increase in CO2 emissions and or atmospheric concentration of CO2 (e.g.- recall there have even been extended periods where CO2 increased substantially and global temperatures reduced or did not increase), then by inference, reducing CO2 emissions would not be expected to show a discernable or repeatable effect on reducing the rate of global temperature rise (or causing it to fall).
On the other hand, the empirical temperature record since 1880, with its varying periods of global warming and cooling, does provide data that countermands the current third paradigm. Namely, the evidence shows that global cooling occurred during substantial periods of increasing CO2 emissions and higher atmospheric concentrations of CO2. The moderate global cooling post 1900 and post 1998 (see Figure 4) under increasing CO2 emissions and higher atmospheric concentrations of CO2 is, of course, not attributed to more CO2, but the empirical observations support the fact that the planetary global warming influence of CO2 greenhouse gas emissions was too small to override the natural variations that resulted in these periods of global cooling. These several examples of global cooling (or lack of warming) under increasing levels of CO2 emissions and significantly cumulatively increased atmospheric concentrations of CO2 in the recent historic record is consistent with the observation and conclusion that there is an absence of any discernable effect of CO2 emissions on global temperatures. This conclusion is likewise supported by the observation of periods time cited above with similar rates of global warming but with very different amounts of annual CO2 emissions and with substantially different atmospheric CO2 concentrations.
The above empirical, observational facts along with the absence of any material evidence supporting the assumption that cutting / eliminating CO2 emissions will control/eliminate global warming clearly refute the third existing paradigm. Thus, the paradigm should shift to one that states:
New Third Paradigm
*******To date there is no material or empirical evidence that demonstrates that reducing / cutting / eliminating CO2 emissions will control / eliminate the current global warming.” *******
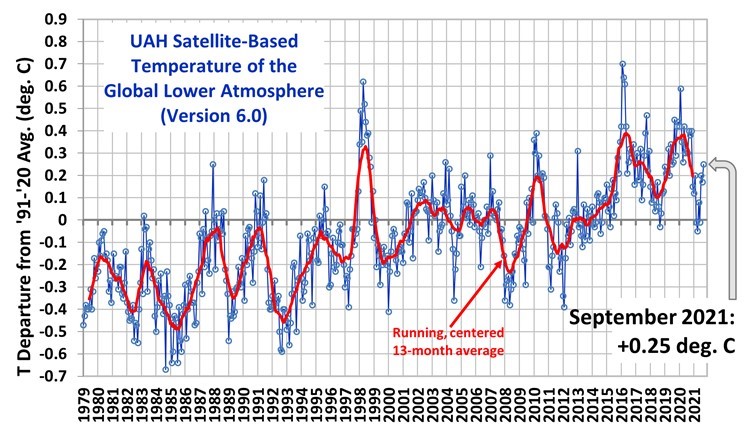
Figure 4 –Global temperatures since 1979 from UAH Satellite Data
Future Considerations – without National Paradigm Shifts
Despite the scientific evidence to the contrary, including the empirical records of the last century and the history of cycles of global cooling and global warming to global temperatures higher than presently being experienced, CO2 emissions continue to be touted as the primary driver of the current global warming. Notwithstanding the dire warnings delivered since 1990, the worldwide rate of rise in CO2 emissions has continued unabated. Undeterred by the reality of the impotent response to CO2 emission reduction to date (in fact there has been a steady rise),*** (see appendix) the purveyors of planetary calamity, trumpet a worldwide plan for about a 45% reduction in CO2 emissions by 2030 and net zero CO2 emissions by 2050. These goals are presented and discussed extensively as though they will actually be achieved. Little is presented or discussed concerning (1) how this would be achieved (2) what the consequences and impacts would be on people and (3) how mandates would be imposed / enforced to ensure compliance in developed and developing countries and whether they would be different. Also, of course, if the CO2 emissions (that have entered the atmosphere) were really the cause of the global warming being experienced, those “escaped” emissions would have to be recovered from then atmosphere in order to eliminate the hypothesized CO2 emission global warming effect. The years 2030 and 2050 are not that far away!!
The IPCC established a maximum acceptable global temperature increase of 1.50 C over the 1850-1900 level by 2050. Reaching this limit of increase is shown (see Figure 5) coincident with the reaching of zero CO2 emissions (2050). (There would have to be, as discussed above, some plan for removal of the added atmospheric CO2 for this plan to work according to their hypotheses). Achieving this 1.50 C goal, as revealed in Figure 5, in perhaps the most egregious and outrageous assertion yet by the IPCC, implies that humans can actually “shut off” global warming (and by extension, all of nature’s natural variations on global temperature change) just by eliminating our CO2 emissions. This shut off is only a reality in their subjective climate modeling. Apparently, the IPCC forgot that planetary temperatures have been varying as a function of natural variation for thousands of years (in the current interglacial) and for hundreds of thousands of years during the glacial cycles. In reality, if we indeed got rid of our CO2 emissions we would revert to natural variation and if we were still in the current interglacial warming cycle which began around 1750, temperatures would continue to increase until the next interglacial cooling cycle began. The IPCC left this reality out of their idealized forecast.
Figure 4 – IPCC plot of future global temperatures if warming held to 1.50C
It is astonishing to think how disruptive, how impractical, how inequitable and how irrational the idea and plan to reach zero emissions by 2050 would be if it were to be put in place or attempted to be put in place. It is inconceivable that:
The bulk of our universe of energy that the world runs on (electricity production, transportation, construction equipment, heating of homes and offices, and manufacturing, and more) and all of the facilities and jobs that support that universe of energy would be eliminated and discarded. The result, if forcefully effected, would be mammoth human suffering and a catastrophic environmental solid waste pile to be “fully” replaced by weather dependent renewables that now supply only a few percent of the planet’s total energy, under significant subsidies.
All of this would be sanctioned and allowed to be done without any concrete, physical, empirical, experimental evidence that it (a) was needed or (b) that elimination and removal of CO2 emissions would have any significant effect on global warming.
To satisfy the conceptual / theoretical role of CO2 in global warming not only would CO2 emissions need to be zeroed out, but massive amounts of CO2 would have to be extracted from the atmosphere to return to the conditions when CO2 emissions were “ostensibly” not controlling global warming, as explained below.
Consider the accounting of CO2 emissions in the atmosphere. If indeed CO2 were the primary driver of the global warming currently being experienced, then CO2 emissions had to, at some particular point in time or over a particular period of time, have taken over control of global temperature change from all the natural solar and planetary system parameters /variations producing changes in global temperature prior to human produced CO2 emissions, as they have for thousands of years. It is well known and well documented that significant changes (increases and decreases) in global temperature took place during glacial periods (+ 10OC), during interglacial periods (+ 1-2OC) and even during periods of a general rising or falling of global temperature trend within an interglacial period (+ 0.2OC). This latter is the case with our current rising global temperature trend which began following the nadir of the Little Ice Age around 1750. Figure 2 shows a portion of that general rising trend (since 1880).
Examination of the empirical record of CO2 annual emissions since 1850 (Fig. 3) would suggest that that a logical point in time to consider that CO2 emissions could have begun to dominate/control global warming was around 1950 when CO2 emissions began to accelerate. However, that date obviously does not work since global cooling rather than warming occurred for over 30 years despite the higher CO2 emissions. The next logical date to consider for a CO2 emission “take over” would be around 1979 when global temperatures began to rise above 1944 levels and at a relatively rapid rate. Any later date would not make sense. Table 1 shows that by 1979 about 400,000 million metric tons (MMT) of CO2 had been emitted world-wide since 1917 (Annual carbon dioxide emissions prior to 1917 were small and were omitted in this tabulation of cumulative totals). The atmospheric concentration of CO2 in 1979 was approximately 330 Parts per million up from about 295 in 1917. Currently the world is emitting about 36,000 MMT annually (up from 20,000 MMT in 1979) and has emitted a total of about 1,550,000 MMT since 1917. The total CO2 emissions added since 1979 is about 1,100,00 MMT. Atmospheric concentration of CO2 now (2021) is approximately 413 Parts per million.
It follows logically that if annual CO2 emission levels and/or atmospheric CO2 concentration levels initiated a state of primary “global warming” control over natural variation then a return to these levels would be required to “just begin” to return global temperature control to natural variation. Cutting / eliminating CO2 emissions to affect a return to 1979 conditions would thus require immediately (1) cutting emissions to 20,000 MMT and (2) extracting 500 billion tons of CO2 from the atmosphere. To return to natural variation in control of global warming would theoretically require returning to at least the 1944 CO2 emission levels (which would mean cutting emissions to 5,000 MT and extracting 750 billion tons of CO2 from the atmosphere). It is irresponsible and disingenuous to promote the idea that either of these objectives can and will be accomplished. Annual CO2 emissions are still rising in most countries, so the actual removal figures would be greater than shown above. Extraction of CO2 from the atmosphere in the quantities that would be required is clearly impractical and cost prohibitive. Most importantly it would be foolish to even consider carrying out these efforts with no proof that they would be successful.
It is recognized that the increased atmospheric CO2 has been steadily increasing crop yields and greening our planet. There are a few installations that have been built around the world that are capturing carbon dioxide from the atmosphere – and what are they doing with it when captured? – paradoxically they are selling it to growers to increase crop yields, exactly what it was doing in our atmosphere
Next, consider that there would be a terrific economic cost (due to physical retrofitting) and environmental havoc that would result in the process of trying to achieve zero emissions. Many common aspects of people’s lives (beyond breathing) involve CO2 emissions such as heating and lighting homes, offices, factories and schools, raising crops to feed the populous, producing goods in factories and construction of homes, airports, roads, office buildings and transportation in cars, planes, busses, and trains. The percentage breakdown of CO2 emissions by sector in the US is (1) 13% Commercial and Residential, (2) 29% Transportation, (3) 10% Agriculture, (4) 25% Electricity Generation and (5) 23% Industry. It is estimated that there are about 1.5 billion cars on the planet, 300 million in China and 268 million in the US. The questions abound – what happens to all the abandoned cars? Where does the energy come from to produce reliable electricity for homes?, for charging electric cars?, for operating factories? Will home heating systems have to be renovated? How will heavy construction be done? What is the energy source and environmental cost of generating new materials to replace transportation elements?, to build batteries?, to make wind turbines currently with a life span of only 20 years?, What is the impact on developing countries?
The currently advertised IPCC projection for future conditions by limiting global warming to 1.50 C (Fig.4 ) is that:
Zero emissions are to be reached by 2050 and then …… woosh global warming will end – the paradigm shift needed is that:
The currently advertised IPCC paradigm presents an unrealistic, concocted scenario (an idea or plan that is impossible or very unlikely to happen) based on conjecture (a postulation and a vain hope that has not been proven, tested or verified).
What about the Future? Based on what is known, what should be done?
The analysis of the CO2 emissions / global warming relationship above illustrated what CO2 emissions are not doing, but the fact is that over 1,700 billion tons, of human produced CO2 has been emitted since 1900, a sizeable percentage of that CO2 (40-60%) entered our atmosphere and because of its longevity most of it is still there. So, there is a need to investigate and evaluate the effects of the roughly 1,000 billion tons of CO2 that we have put into the atmosphere and to which we are adding about 20 billion more tons each year. The presence of this added CO2 is evident in the measured concentration of CO2 increasing from about 300 ppm around the turn of the century, to 315 ppm around 1944, to about 330 ppm around 1979, to nearly 420 ppm currently (2021). The atmospheric concentration due to human emissions is rising at a rate of about 45 ppm per decade. The amount of our CO2 emissions in the atmosphere constitutes about 0.014 % of the atmosphere.
What does the existence of this large, “non-natural” modification to our atmosphere, that has been developing in earnest since 1944, and has been “substantially” developed for the last 40 years tell us? And what should we be doing to investigate and document its effects?
What it tells us and what needs doing:
While the notion that the multiple parameters that have influenced and controlled the natural cyclic and intracyclic variations in global temperature, (warming and cooling), that are evident in the historic record were essentially overtaken and usurped by the influence of emissions of one minor greenhouse (CO2 ), such that these other influences on global temperature (warming) became inconsequential, seems unfathomable, but assume for the moment that it did occur as presently declared and propagated. If so, the obvious questions are: (1) At what atmospheric concentration did CO2 emissions become the primary influencer of global temperature change?, and (2) Under what circumstances (e.g. atmospheric concentration of CO2) will global temperature change, (warming and cooling) return to the control of natural variables (non human influenced) conditions.
The only reasonable answer to the first question is around the period 1975 -1979 when the atmospheric concentration of CO2 reached about 330 ppm (and annual emissions were 20,000 MMT). This is because prior to that time (1945-1979) there was planetary cooling (global temperatures remaining below the 1944 level), and after that time a rapid warming took place until 1998 (followed by a period of lower global temperatures). The logical answer to the second question is that the atmospheric concentration of CO2 would need to return to at least below the 330 ppm CO2 “triggering” level to return global temperature variation to “natural variation parameters” if the prevailing conjecture were indeed valid? Since CO2 emissions continued (and at an ever increasing rate post 1979) this means that a “reservoir” or surplus of added CO2 above the level of “CO2 emissions becoming the primary driver of global warming” developed. That surplus is currently about 750 billon tons of CO2. Thus:
To remove CO2 emissions from their alleged primacy role in driving warming would not only require eliminating CO2 emissions but also extracting roughly at least 750 billion tons of CO2 from the atmosphere.
If indeed CO2 emissions “took over” control of global tempatures, and thus “the ongoing, current global warming” at around an atmosphic CO2 concentration of 330 ppm (circa 1979) and that resulted in the 0.470 C rise in global temperature by 1998, (a 0.250C rate of increase per decade – see table 1), then it would certainly be expected that the ever increasing amount of CO2 emissions entering the atmosphere following 1998 would have produced an accelerated, ever increasing rate of global temperature rise. However, as evidenced in Figure 4, not only was there not an acceleration of global warming “under the ever increasing amount of CO2 emissions post 1998” but essential there was a substantial number of years after 1998 with lower global temperatures and through 2021 there has been little increase in overall warming at all. In fact, right now, January 2022, the global temperature is about 0.40C less than the global temperatures recorded in early 1998.
This is not to say that the current overall global warming cycle has ceased, not at all, rather it illustrates that the natural variation with periods of greater and lesser warming (and some periods of cooling or little change) that has occurred historically is still taking place (see figure 2), but most importantly it illustrates that a continuous, ever increasing rate of rise in global temperatures is not occurring due to the greatly increased atmospheric CO2 concentration. That would be the expectation under the paradigm of CO2 emissions being the primary driver of global warming and that is not occurring.
The IPCC endorsed paradigm promulgating CO2 emissions as having primary responsibity for the global warming being experienced (circa 1990) was an assumption based on observation of the post 1979 concurrent rise in global temperatures and the ongoing increase in CO2 emissions. This hypothesis was essentially accepted as a fact and was not subjected to rigorous independent examimation and proof based on the scientific method. Rather, it was buoyed and reinforced using subjective climate modeling, endorsed and sustained by the positive spin off / by products of what the paradigm called for, (such as cutting pollution from fossil fuels and enhancing/greening the environment) and anecdotally reinforced by the ongoing “expected” outcomes of the ongoing cycle of global warming (e.g. glaciers melting). Subsequently, this misconception (that the primary cause of the global warming being experienced is anthropogenic global warming due to CO2 emissions), was given the pseudonym “climate change” and became a cause celebre and spread to every sector of society – including economic, academia, media, and political. Further, despite the lack of a reasonably rigorous scientific investigation to support it, debate/discussion of the issue was shut down with claims that it was “settled science” and that anyone questioning the claim was a “denier”. The classical error of assuming “correlation proved causation” was made by the purveyors of the paradigm that CO2 emissions were primarily responsible for the current global warming and this error was all the more egregious due to basing the correlation on only a small portion (post 1979) of the global temperature record. But now, once examined by the full extent of the empirical evidence, it is evident that the increasing CO2 emissions did not, during formative stages (1945-1975), and do not presently have the dominate effect on global temperatures that was assumed.
So in light of the fact that the actual effects of the burgeoning CO2 emissions going into the atmosphere (which have now reached 1000 billion tons) were not rigorously and scientifically examined, what should be done now? It is imperative that the possible effects of the large quantity of CO2 emissions that have been added to the atmosphere need to be identified/brainstormed and then monitored and investigated. The efforts required include:
Brainstorm what positive and negative effects may be occurring, so as to identify and monitor the effects due to the presence of CO2 added to the atmosphere,
Scientifically examine the possible effects hypothesized with particular attention to observing increasing effects with time in concert with the accelerating rate of CO2 emissions since about 1945. (Note that the increased greening of the planet, which is consistent with a fundamental effect of atmospheric CO2, has already been demonstrated and documented.)
Establish realistic goals for reduction of fossil fuel use, not because of CO2 but to reduce pollution and develop alternative energy supplies.
Convert as many futile CO2 “climate change” study efforts as possible to the above efforts in order to determine what, if any, adverse effects of the increased atmospheric CO2 are and how they should be addressed.
Conclusion
National Global Warming Paradigm Shifts are badly needed as are investigations of what if any are the real identifiable effects of the increased atmospheric CO2.
***Appendix
Chill out about global warming The evidence doesn’t establish that it’s ‘the existential threat’
At the United Nations Climate Summit (aka COP26) in Glasgow last week, President Biden declared that climate change is “the existential threat to human existence as we know it.”
Based on that judgment, he plans to implement policies that will weaken America’s national security and economy, as well as slow development in poor countries. Perhaps this question occurs to you: Is Mr. Biden’s judgement, correct?
Those arguing that it is not include Steven E. Koonin, who served as the senior scientist in the Department of Energy under President Obama. Mr. Koonin does not “deny” that the climate is changing or that human activity is influencing that change.
He provides data showing that heat waves in the U.S. “are now no more common than they were in 1900,” that “the warmest temperatures in the US have not risen in the past fifty years,” and that “Greenland’s ice sheet isn’t shrinking any more rapidly today than it was eighty years ago.”
If you’ve been led to believe otherwise, that’s probably because activists have been “exaggerating and distorting” the evidence to make the case that “we are facing the ‘last, best chance’ to save the planet from a hellish future.”
He notes that the most recent report of the Intergovernmental Panel on Climate Change “deems its highest-emissions scenarios of the future unlikely, even though those are the ones you’re mostly likely to hear about in media reports.”
Since the late 1800s, he points out, the world has warmed by about 1 degree Celsius without significantly adverse consequences. He postulates that “even 1.5 degrees of additional warming by 2100 will have minimal net economic impact.” He scolds commentators who fail to grasp the difference between weather and climate.
Bjorn Lomborg, who heads the Copenhagen Consensus Center, contends that policies aimed at cooling the planet quickly are bound to fail. Even if the U.S. went “entirely net zero” on carbon emissions tomorrow, he has calculated, that “would only cut temperatures by the end of the century by 0.3 degree Fahrenheit” – barely measurable.
That’s because “most of the emissions in the 21st century will come from China, India, Africa, the rest of Southeast Asia, Latin America – countries that are now trying to lift their populations out of poverty and obviously have much greater priorities than cutting carbon emissions.” Ugandan President Yoweri Museveni recently wrote: “Africa can’t sacrifice its future prosperity for Western climate goals.”
Mr. Lomborg urges a different approach: increased investment in “green energy research” to develop sources of power cheaper than fossil fuels. And, of course, we could cut carbon emissions immediately by switching from coal to natural gas and bringing online nuclear power facilities such as those France utilizes. Why those options are rejected by most activists we’ll leave for another discussion.
Mr. Lomborg emphasizes the human ability to adapt to climate change. Farmers will switch crops. Levees and dikes can protect low-lying areas near oceans as is already the case in below-sea-level Holland and New Orleans. Since trees ingest carbon dioxide, boosting re-afforestation can be helpful. Keeping free markets free spurs innovation.
By contrast, “climate summits” – 26 of them since 1992 – where politicians arrive on private jets, virtue signal, spew hot air, and make promises they can’t or won’t keep bring no progress. Perhaps you noticed that, just before COP26, Mr. Biden was pressuring OPEC to produce more oil.
Another shortcoming of the current approach is that “renewable” sources of energy are less renewable than advertised. The Manhattan Institute’s Mark P. Mills has noted: “Wind and solar machines and batteries are built from nonrenewable materials. And they wear out. Old equipment must be decommissioned, generating millions of tons of waste.”
“Building enough wind turbines to supply half the world’s electricity would require nearly two billion tons of coal to produce the concrete and steel, along with two billion barrels of oil to make the composite blades,” he added. “More than 90% of the world’s solar panels are built in Asia on coal-heavy electric grids.”
As for electric cars: “A single electric-car battery weighs about 1,000 pounds,” Mr. Mills wrote. “Fabricating one requires digging up, moving and processing more than 500,000 pounds of raw materials somewhere on the planet.”
Other drawbacks include the need for rare-earth metals and other materials that will be mined “in nations with oppressive labor practices. The Democratic Republic of the Congo produces 70 percent of the world’s raw cobalt, and China controls 90 percent of the cobalt refining.” Perhaps you’re aware, too, that Chinese President Xi Jinping, who didn’t attend COP26, is building new coal-powered plants.
Last month, Mr. Xi tested a nuclear-capable hypersonic missile that could be used to launch a first strike against the U.S. Also last month, Nicolas Chaillan, a senior cybersecurity official at the Defense Department, resigned, explaining that because the Pentagon is not prioritizing cybersecurity and artificial intelligence, successfully competing with China in those strategic areas will be impossible anytime soon. Ignoring such warnings, the Defense Department last week announced plans to name a “senior person” to – perhaps you guessed – “prioritize” climate change.
Almost three years ago, Rep. Alexandria Ocasio-Cortez, declared that “the world is going to end in 12 years if we don’t address climate change.” Based on that judgment, she’s determined to implement her “Green New Deal,” ignoring the perspectives of experts such as those quoted above. Perhaps it occurs to you that Mr. Biden and others who are following her lead are not following the science.
Conclusion: National Global Warming Paradigm Shifts Are Badly Needed and Inve
John Muir, naturalist and noted environmental advocate said, “When we try to pick out anything by itself, we find it hitched to everything else in the Universe.”, and so it is with electric vehicles and especially with the production of their very hefty batteries.
Just how “Green” are Electric Vehicles (EV), that is: Are they good for the environment? Do they combat “climate change” by using renewable energy? To answer those questions, one needs to know: (1) What is the actual energy source for EV batteries? (2) What are the energy expenditures and natural resource costs in producing the very heavy electric batteries used in Electric Vehicles? (3) What would the potential environmental, economic and social effects related to replacing all combustion engine cars, trucks, construction vehicles with electric vehicles be, if done within the time frames being proposed? (4) And finally, where and how is electric vehicle operation especially good for the environment?
The short answers to each of the first three questions are given below and the fourth on electric vehicle environmental benefits deserves and has its own section:
An electric vehicle is only as “green” as the fuel source used to generate the electricity that charges its battery. The majority (84%) of the electricity in the electricity grids used to charge electric vehicle batteries in the US is produced from fossil fuels and nuclear energy, (64% -natural gas and coal fired power plants and 20%-nuclear plants). Similarly, in the World the majority of electricity (84%) is produced from coal (34%), natural gas (23%), hydroelectricity (17%) and nuclear energy (10%). In a few countries, (e.g. Albania, Norway, Paraguay, the DRC), the electricity grid is powered by all or mostly hydroelectricity so in those locales electric vehicle operation is truly “green”.
According to the World Economic Forum producing an electric vehicle contributes, on average, twice as much to “global warming potential”1 and uses double the amount of energy than does producing an internal combustion engine (ICE) car, mainly because of the electrical vehicle battery. A 1000-pound EV battery contains 25 pounds of lithium, 60 pounds of nickel, 44 pounds of manganese, 30 pounds of cobalt, and 200 pounds of copper. (Note: A Tesla Model S battery weighs 1200 lbs., A GMC Hummer battery weighs 9000 lbs.) To get these metals for just one battery requires processing 25,000 pounds of brine for the lithium, 30,000 pounds of ore for the cobalt, 5,000 pounds of ore for the nickel, and 25,000 pounds of ore for copper. In all 250 tons (500,000 lbs.) of rock and soil are excavated and processed for one battery. Even to supply the current limited production of electric vehicle batteries, obtaining the toxic cobalt and lithium is problematic, not only from a resource availability standpoint (The Democratic Republic of the Congo holds 70% of the Cobalt reserves), but also from health, safety and social perspectives.
1 Global Warming Potential is based on model studies that subjectively attribute global warming to CO2 emissions. However, the available empirical evidence (NASA temp. record and CO2 emissions records), for the period 1880 to the present shows that global temperatures do not corelate with CO2.
3. There are now (2022) about 1.5 billion vehicles in the world and roughly just 10 million are electric vehicles (less than 1%). Annual new car production is projected to grow from about 84 million in 2022 to 127 million by 2035 with still only a small percentage projected to be electric battery vehicles (2-4%). To meet the stated/planned objective of zero CO2 emissions by 2050 would mean (1) mass disposal of the stock of still functional gas fueled vehicles, (2) a huge expansion of the production of electric vehicle batteries, and (3) development of non-fossil fuel electric generating capacity to reliably charge the electric batteries. Each of those activities would in turn have enormous adverse social, economic and environmental (e.g. solid waste) consequences. And, paradoxically as noted, this replacement would not directly reduce emissions as the replaced vehicles would have to be charged by the electricity grid. So only if the grid is 100% fueled by renewables would the zero CO2 emissions goal be met and accomplishing that creates another set of environmental and practical dilemmas.
It should be reasonably clear, from the short explanations above, that the operation of Electric Vehicles does not significantly add or detract to global CO2 emissions. But the “embedded energy costs”, and thus the associated emissions, from production of an electric vehicle and their batteries exceed those of producing a gas engine vehicle. Therefore, the statements2, claims, and assertions coming from the current administration and other “experts” that “climate change” is being addressed by going to electric vehicles and by the charging stations and electric grid network being funded by the Infrastructure Bill are either disingenuous, promotional hyperbole or are made from a lack of understanding of the actual, true environmental benefits, merits and costs of electrical vehicles (and especially the practicality of a complete transition to electric vehicles).
2 Per the White House issued statement, “The bill invests $7.5 billion to build out the first-ever national network of EV chargers in the United States and is a critical element in the Biden-Harris Administration’s plan to accelerate the adoption of EVs to address the climate crisis…..”
Electrical Vehicle Benefits
If not a reduction in global CO2 emissions, what are the benefits of electric vehicles? The primary and very important benefit of electric vehicle use is environmental. Their use avoids the air pollutants (NO, N2O, NO2, SO2, particulates, etc.) from the burning of fossil fuels in gasoline engines. Their deployment and operation in densely populated areas can greatly help the air quality by reducing air pollution from Internal Combustion Engines. That is the key aspect of electric vehicles that should be capitalized on because that is where electric vehicles can do the most good. Smaller batteries with less environmental impact from their production are required for the lesser range, local driving within cities and metropolitan areas. Further the electric batteries can be charged in homes or at work places using less costly charging stations and without the need for enhanced electrical grids.
Rather than focusing on the metropolitan areas for deployment of electrical vehicles, where the most good can be done by any government assistance, the recently passed Infrastructure Bill proposes to use the $7.5 billion fund for charging stations in rural areas and to “strategically deploy EV charging stations to build out a national network along our nation’s highway system.” And to spend $65 billion on upgrading the electrical grid to ensure that these charging stations along our nation’s highways are functional. This plan is flawed. (1) The Level 3 more rapid charging stations, which would be required to charge EV’s traveling highways, cost 50 to 100 times more than the Level 2 stations in use in homes and work places. (2) Electric vehicles are not as practical in rural areas and are more costly to buy and operate and thus less likely to be purchased by rural residents. The rural demand for electric vehicles will be less, and the need/rationale to go electric reduce air pollution is less. Thus, the need for charging stations in rural areas is lesser. (3) The batteries needed to operate the longer ranges associated with highway / rural travel would be much larger and much more expensive. And (4) As noted above the number of electric vehicles will still be relatively limited for a number of years especially in the areas where their use is less advantageous to the potential buyers. Thus, while the Infrastructure Bill focus on expansion of electric vehicle access for rural and highway travel is proposed to broaden the scope of electric vehicle travel and make up for underserved areas, it is inconsistent with the actual need and benefit associated with electrical vehicles.
Focusing on the development, production and use of electric vehicles and their batteries for use in metropolitan area settings makes a lot of sense and would help avoid the potential social, economic and political problems that would be confronted in trying to replace all existing vehicles with electric engines.
Social, Political and Environmental Aspects associated with transitioning to Electric Vehicles
The production of electric vehicles and their batteries is just in its formative stage. From 2010 to 2019 approximately 5 million electric vehicles were produced and currently 2-3 million new electric vehicles are being produced each year, making up about 3% of new car sales worldwide. While that proportion is projected to increase rapidly (to 10% by 2025 and 28% by 2030) it is relatively astonishing and disconcerting to observe the environmental and social problems, even at the current low level of 3% of all new cars, that are associated with the mining for the metals used in electric vehicle batteries. The “metals in batteries … are scarce, expensive, or problematic because their mining carries harsh environmental and social costs”.3 Here are two situations that elucidate this assessment and expose a couple of the environmental and social concerns associated with obtaining the raw materials required for the making the currently used lithium-ion electric vehicle battery.
About two-thirds of all the cobalt used for production of electric vehicle batteries currently comes from the Democratic Republic of the Congo (DRC). About 20%-35% of the cobalt supplied by the DRC comes from “artisanal” mining by families (fathers, mothers and children) who extract the toxic cobalt near surface, without protective equipment. Steps are being discussed to improve the situation for the 100,000 to 200,000 people whose livelihoods are derived from this “informal” gathering of cobalt but there is considerable visual documentation (e.g. in articles and u-tube videos) that shows the primitive “cobalt mining” and unhealthy conditions that constitute this “artisanal” mining of cobalt for electric vehicle batteries by the people in the DRC is ongoing. These families are literally scratching out a living (reported avg. daily earnings of about $2-3) in support of electric vehicle battery production.
In the parched Atacama Desert of Chile about 34% of the lithium currently being used worldwide for electric vehicle batteries is produced. Enormous quantities of water are required to produce useable lithium. The water is used to form a subsurface lithium / water brine that is then pumped to the surface where the water evaporates. As noted above, the 25 lbs. of lithium required for a 1000-pound electric vehicle battery requires 25,000 lbs. of water to process it. Water is of course a precious commodity in this desert environment and its use to process the lithium (using nearly 65% of the water in the Salar de Atacama region) makes freshwater less accessible to the surrounding eighteen indigenous Atacameno communities.4
What is particularly striking about these accounts is that the projections for increased needs for the electric vehicle battery production are huge (the IEA forecasts a 42 times increased need for lithium by 2040 over the 2020 output) and a similar increase in cobalt would be required. Reflecting on the problematic/strained status of environmental and social conditions in producing the “relatively minimal” 2020 supplies of the minerals required for electric vehicle battery production gives one great pause.
3 Electric cars and batteries: how will the world produce enough? Nature.com August 17,2021
4 “The rush to ‘go electric’ comes with a hidden cost: destructive lithium mining” by Thea Riofrancos in, The Guardian, June 14, 2021
Summary
Electric vehicle operation, especially in densely populated areas, provides a huge environmental benefit to improvement of and maintenance of good air quality. The focus of expanding electric vehicle acquisition and use (as well as any government subsidy or assistance) should be directed towards electrical vehicle use in large metropolitan areas. Electric vehicle operation in cities is advantageous because of the shorter driving distances involved which in turn means smaller batteries are required and charging is more convenient. Because electric vehicle batteries operate off the local / existing electrical grid by which they are charged, electric vehicles do not per se affect “climate change” via reducing global/regional carbon dioxide emissions. This is because the electrical grid is powered by whatever the local electrical power generating fuel is and at present that fuel is predominately fossil fuels.
The extraction and processing of lithium and cobalt required for the current lithium-ion batteries, currently being produced for electric vehicles, is socially and environmentally problematic and is somewhat taxing the available resources even for the relatively small number of electric cars being produced currently (about 3% of new cars). Expansion of electric vehicle battery production to the levels currently being projected would seem to be much greater than is realistic. Further the social, economic and environmental aspects associated with the disposition / replacement of the tremendous numbers of gas engine vehicles is mind boggling. There are currently 1 billion 400 million gas engine vehicles operating world-wide, and on average over 100 million more per year will be produced from now till 2035. If according to current goals emissions are to be reduced by 50% by 2040 and 100% by 2050, replacement of the entire planets gas engine fleet by 2050 is not even close to being practical or equitable.
Finally, the typical discussion and projection of the transitioning to electric vehicles in the name of “emissions reduction” does not recognize that in the US, currently, 28% of greenhouse gas emissions are from transportation and 27% from electricity (industry, commercial/residential and agriculture contribute the rest). If the transportation sector converts from gas to all electric battery operation, then ostensibly the electricity sector would have to increase its capacity (and associated fuel usage) enough to supply the energy now used by transportation, so in rough terms the electricity sector would then contribute 50+% of the greenhouse gas emissions. The electric vehicles themselves do not cut global CO2 emissions.
Larry Von Thun, Civil Engineer, Lakewood, Colorado
Global Warming 102 – Global Temperatures – Past, Present and Future
Background — After a sustained period of cooler global temperatures from 1944 to 1980, the earth began to steadily warm again in accordance with the current long term warming trend (since 1650 and a matter of NASA record since 1880). As we moved into the late 1980’s the earth’s temperature was getting increasingly warm, reaching temperature levels nearing the high temperature peaks indicated in the earth’s previous cooling/warming cycles (see figure 1). People were beginning to get concerned. It was known that manmade emissions of CO2 had been increasing greatly (since about 1945) and it was known that the CO2 in the atmosphere is a contributor (albeit a minor one) to keeping heat from escaping the earth. Thus, it was reasonable to hypothesize that the large increase in CO2 emissions by human activities was increasing the rate of global warming. This was a hypothesis and like any hypothesis it needed to be examined, tested, and verified before it is accepted as fact. The hypothesis was challenged in Global Warming 101 based on empirical records showing extended periods of global temperature cooling concurrent with steadily rising emissions of CO2.
In Global Warming 101 using a graph showing the avg. annual global temperatures since 1880 and a second showing the rates of increase in human source carbon dioxide emissions, three basic conclusions were reached: (1) the earth is in a period of global warming and has been warming for a very long time, (2) though there is overall warming there are long periods (tens of years) of cooling or of relative stability in global temperatures, and (3) the existence and rate of global warming is not being significantly influenced by human source CO2.
In Global Warming 102 you will be provided with four basics relative to the global warming and “climate change” discussions. These factual data will give you a foundation to help you read, understand, interpret and evaluate the truth or lack of it in the rhetoric heard and in the articles written on this subject. Most of such communication commonly seen is to persuade for political or advocacy purposes. However, there have been, since the late 1980’s, a plethora of technical articles on the subject written supporting the theory that CO2 emissions are responsible for global warming. The articles of this bent that I have reviewed tend to be narrowly focused and very analytical, or they have been written to specifically counter some aspect of the technical opposition to this prevailing theory. Similarly, the articles opposed to the human caused argument for global warming present their viewpoint and are biased toward that point of view. Thus, it becomes difficult to assess the situation. My objective is to provide you with easily understood factual data that helps in this regard.
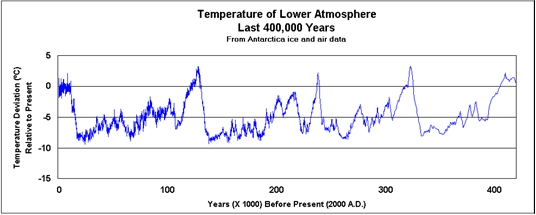
Long Term Cyclic Temperature Record – The first essential is to understand the context of the current discussion with respect to the very long term and the extremely long term temperature record of the planet. We all know about glaciers and how they advanced and retreated. The last glacial period started about 110,000 years ago and ended about 15,000 years ago. During that time period there were about 8 advances and retreats of the glaciers as the earth alternately cooled and heated within the last glacial period. Now, looking at the very long term there are extended periods or cycles of warming followed by extended periods of cooling. Figure 1 shows how those cycles look based on ice core data from Antarctica. Note how the cooling trends last for a very long time and how the warming trends tend to shoot up rapidly (speaking in terms of geologic time). Also note how the past 3 peaks were much sharper and higher than the current peak. The reason for this is not known.
Figure 1 – Temperature changes over a period of 400,000 as derived from Antarctica ice core ( Note: similar data has been derived from ocean sediments)
Many people with knowledge of glaciation and of this long term cyclic record of the earth’s temperatures, which goes back 800,000 years, did and still do question the man caused global warming assertion promulgated by the United Nations Climate Committee in the late 1980’s.
Terminology –The second piece of basic information to understand is the relationship of the term Global Warming to the now popular but imprecise term “Climate Change” and the “non-obvious” implication of this term and, as an important detail, the ways the average global temperature is determined.
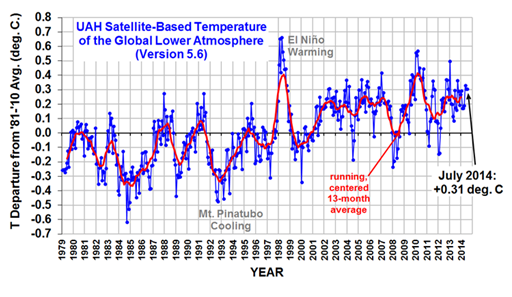
Global Warming means the year to year increase in the “average” global temperature. This “average” temperature is now measured in two ways. (1) The first, and oldest, means of establishing this average is via a land – ocean array of sites. It is the one used in the NASA Global Temperature Index for Land & Ocean shown in Global Warming 101. (2) The second, is the average temperature of the lower troposphere (near surface layer) obtained from satellites passing over the array of measuring locations around the globe twice a day. The satellite array (established in 1978) has the intended advantage of removing the effects of the “urban heat sinks” present in the land-ocean array. The satellite data, are interpreted and published by two different groups that are referred to as RSS and UAH. The UAH plot is by the University of Alabama at Huntsville and the RSS data is from Remote Sensing Systems (RSS), a scientific research company located in Northern California, specializing in satellite microwave remote sensing of the Earth. Although the analysis techniques for interpretation of the data are different the results are quite similar. Figure 2 shows the history of the average global temperature record since 1979 from the UAH source. As in the land-ocean record there was a peak in 1998, however in the satellite data the peak was very sharp and since that time the satellite data show that that the 1998 average global temperature peak has not been exceeded. That is why you will hear it reported that the “earth has been cooling for the last 18 years” and at the same time hear reports, (like President Obama’s statement in the 2014 State of the Union address), that 2014 was hottest year on record. Both statements were true, they are using different data sets. According to the satellite data, 1998 is the hottest year on record, 2010 is next and then 2015. According to the land-ocean data the 1998 temperature represented a local peak and since then the trend is slowly creeping upward, however there was a big increase in 2015 and that might be seen in 2016 as well as it is another El Nino year.
(1) Figure 2 – Global temperatures from satellite data since 1979 (UAH_LT_1979 Through Dec 2014) A global temperature high (as measured from satellite data in the lower troposphere) was reached in 1998 and since that time (17 years and counting) global temperatures have been at or below that peak level.
“Climate Change” — This term is now used as a euphemism for “anthropogenic global warming” – i.e. global warming being caused by humans. The term appears to have been intentionally adopted as a means to focus attention on and engender concern about the recognized adverse physical effects of global warming – glaciers retreating, polar ice diminishing, and the range of plants and animals being impacted, and at the same time shrewdly imply or infer that the cause of these physical effects is human source CO2, as though the question was settled. It is an imprecise term technically, that has obscured the real question of whether the current warming is “anthropogenic”, or is due to natural forces. Use of the term effectively discredits, in the public eye, the many climatologists scientists and technical people who challenge the CO2 – anthropogenic global warming assertion. This public media discrediting is easy because it infers that the “skeptics” or “deniers” are arguing that the “climate change” physical effects are not occurring and it makes them look totally unrealistic and out of touch.
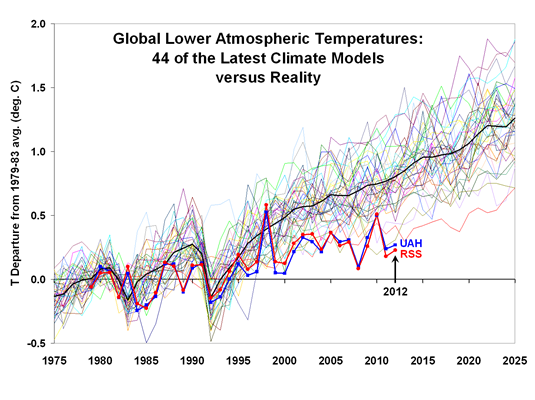
Climate Models – The United Nations established the International Panel on Climate Change (IPCC) in 1988. The IPCC was charged to obtain, “scientific, technical and socioeconomic information relevant for the understanding of the risk of human-induced climate change.” Notice that it appears that the IPCC was not charged with investigating the hypothesis of whether or not global warming was being influenced by human source CO2, but rather to start with that assumption and show the risks. And as it turns out the IPCC is fulfilling their charge by conveying that there is considerable risk. The IPCC panel concluded in their first assessment report in 1990 that: “anthropogenic climate change will persist for many centuries “. The IPCC funded an abundance of studies, resulting papers and climate models that supported their initial conclusion and a positive feedback loop developed that led to the IPCC’s subsequent assertion that human generated carbon dioxide emissions are the major cause of global warming. The global warming models sponsored / paid for by the IPCC typically integrated or incorporated in their analytics a very adverse effect due to rising CO2 levels. As can be seen in Figure 3, the models greatly overestimated the actual global warming that has occurred since 1998. The results of these models were a primary rationale for the IPCC’s ominous warnings to the international community on the expected increases in global warming and associated adverse impacts (e.g. rising ocean levels). These results were a prime driver of the global efforts to take action to reduce carbon dioxide emissions such as the Kyoto Protocol. Now clearly seen as overestimates, IPCC models are still being used to justify warnings. Note that although these models clearly appear to be inaccurate because of their emphasis on incorporating assumptions about the dramatic effects of CO2, this is not to say that there will not be another sharp rise in global temperatures as there was post 1933 and post 1976. The pattern of relative stable global temperatures since 1998 could well change in future years due to natural forces.
Figure 3- Climate models under IPCC auspices give projections of warming far exceeding the actual level of global warming as recorded post 1998 by the two official interpretations of the lower atmosphere temperatures based on satellite data (RSS – Remote Sensing Systems and UAH – University of Alabama at Huntsville).
World Wide CO2 Emissions – The fourth essential to be aware of is the worldwide distribution of CO2 emissions. For a variety of reasons US and European human source CO2 emissions have increased only marginally since 1965 and since about 2007 are declining (see Figure 4). Emissions from Asia-Pacific countries (primarily China) have been greatly increasing, keeping the overall global human source CO2 emissions advancing at the steady, high rate observed in the graph presented in global warming 101. This illustrates the irrational efforts to restrict United States CO2 emissions to effect “climate change” when such restrictions, (1) are based only on theory and have no verifiable evidence of a positive effect, (2) are offset many fold by the emissions being produced by Asian countries, and (3) can adversely impact the U. S. economy and people’s livelihoods. The first point, that there is no demonstrable empirical evidence that CO2 restrictions can have a meaningful effect on reducing average global temperature appears to me to be irrefutable. This is because CO2 emissions are on the rise and have been on the rise for more than a hundred years. Thus, there has never been a sustained time period with reduced CO2 emissions to allow such evidence to be obtained. Of course the fact that there has not been the chance to really test a global reduction in CO2 does not prove that it would not have an effect, it simply illustrates that such evidence is lacking. Further, it does not preclude cutting CO2 based on a confident belief or hope that it would have a positive effect. However, evidence does exist that while human source CO2 emissions were increasing 4 fold over a period of 24 years (1944-1978), global temperatures decreased. Such evidence casts serious doubts about the efficacy of cutting CO2 to reduce global temperatures. Regulations that would cut CO2 emissions would make only a small reduction in the US contribution and as can be seen from the rate of rise in Asia Pacific emissions the US cuts would pale in comparison to the increases by the developing countries on which restrictions are not being placed.
Figure 4 – Emissions of CO2 since 1965 – in the United States, Europe and the Asia Pacific
Based on what is known and can be observed from the historic temperature records, the long term trend of global warming will continue for an unknown time period. The trigger or triggers that have caused the global temperature cycles to reverse direction (see figure 1) are not known. Based on actual empirical evidence there is no reasonable expectation that reducing CO2 emissions will have any significant effect on global warming, even if it could be accomplished, which appears very unlikely based on the emissions of developing nations.
The bottom line is that global warming is continuing at an irregular pace and does not appear to be significantly influenced, positively or negatively, by human produced CO2 emissions based on empirical evidence. Thus, with respect to global warming our nation’s efforts should be directed toward assessing and addressing the potential adverse impacts of global warming. The burning of fossil fuels should not be discounted as a problem but rather be addressed relative to the actual pollutants released by that activity. Alternative energy sources should continue to be developed because it makes sense to do so.
Human caused global warming and the reduction of CO2 emissions to slow or reverse global warming were and still are hypotheses. These hypotheses can be countered and shown to be doubtful using empirical data. An impending, human induced “climate change” calamity continues to be presented to the American people and the world as if it were absolute reality, and as if something meaningful could be done to abate it. There are apparently many in the scientific and technical community who belief this to be true. In future episodes we will examine the rationale for that belief. There are many who simply accept that what most in the technical community believe must be true. And there are some who use their belief in the “climate change” scenario for socio-political and personal economic purposes. For my part, I see the empirical evidence painting a different picture. I am trying to provide what I believe to be the factual information related to this subject. So many in the public eye talk about this topic but have no idea what the basic facts are. I invite you to join Global Warming 103, where with this foundation of factual data as a base we will begin to trace the history of the rise of the global warming concerns and learn about the Al Gore’s “convenient omission” that led so many astray on a very important point. Thanks, Larry Von Thun
Global Warming 101 –Understanding the issue in two easy steps
You hear claims that:
There is Global Warming!
That there has been no Global Warming for the last 17 years!
That Carbon Dioxide is largely responsible for the global warming now occurring!
What is true? – What are the facts?
There are two key graphs that record what has occurred over more than a hundred years with respect to the rise in Global Temperatures and the increase in human source CO2. These two graphs, shown and explained below, provide factual information that reveals what is really known and true about global warming and its empirical relationship to the increases in human source CO2.
Introduction to the issue – After a sustained period of cooler global temperatures from 1944 to 1980 (see figure 1), the earth began to steadily warm again in accordance with the current long term warming trend (since 1650 and a matter of record since 1880, see Figure 2). As we moved into the late 1980’s the earth’s temperature was getting increasingly warm, reaching temperature levels nearing the high temperature peaks indicated in the earth’s previous cooling/warming cycles. People were beginning to get concerned. It was known that man made emissions of CO2 had been increasing rapidly (since about 1945) and it was known that CO2 in the atmosphere is a contributor (albeit a minor one) to keeping heat from escaping the earth. Thus, it was reasonable to hypothesize that the large increase in CO2 emissions by human activities was increasing the rate of global warming. This was a theory or hypothesis and like any hypothesis it needs to be examined, tested, and verified before it is accepted as fact. So let us test the hypothesis!
Step 1 —The first, really important graph, is that of the average annual global temperature based on numerous land and ocean sites around the earth (Figure 1). This plot is the NASA Global Temperature Index for Land & Ocean and you can see it on their site – climate.nasa.gov/vital-signs/global-temperature. It shows the average global temperature value for each year (light red line) in degrees centigrade above or below the 0 reference line as well as a running 5 year mean (dark red line). The data extend back to 1880 and clearly show that there has been net global warming over the last hundred and thirty years. Therefore, that is a well-documented scientific fact! However, this graph also shows that that rate of warming has been irregular. If you look closely at the peaks and valleys of this record you will see something very interesting and very telling with regard to global warming and CO2.
Figure 1- NASA global temperature data plot – (NASA Headquarters release No. 12-020)
The year 1880 is when this record started and it happens to be around the time human source CO2 was beginning to increase. This can be seen on the second important graph (Figure 2). The Fig. 2 plot also indicates that the current warming cycle or trend extended back to 1659. (It happens that the estimated coldest year of the “Little Ice Age” was around 1650). Now, as promised, there is something very interesting when you look closely at the Figure 1 plot. You will see that the average global temperature for 1900 was not exceeded till the mid 1930’s. In fact, there was a net drop (global cooling) between 1900 and 1933 of 0.19 degrees C. Then temperatures began to rise rapidly and by 1944 the average global temperature had risen 0.53 deg. C in 11 years. Now look closely at Figure 1 again and you will see that after 1944, 25 years passed before the 1944 average global temperature was exceeded (global cooling again for 25 years). In fact, by the mid 1970’s there were scientists issuing “alarms” of an impending “ice age” and that forecast was being carried to the public in the newspapers. And why not, the global average temperature in 1976 was 0.37 Deg. C below that of 1944. Brrr was the word of the day. But just as in the 1900 to 1933 period, warming picked up again and between 1976 and 1998 (a peak el Nino year) the average global temperature rose by 0.74 deg. C. This yielded a net temp rise of 0.71 degrees C from 1900 to 1998. So that that is roughly 0.7 degrees per century.
Step 2 – These average global temperature ups and downs are interesting but when they are juxtaposed in time with the record of CO2 increase they reveal much, much more!! So, look now at the graph of the rise of the global CO2 emissions on Fig.2. Note that the rate of increase in CO2 was fairly steady between 1880 and the mid 1940’s and then the rate increased greatly and has continued at that high rate to the present. This step involves examining what happened to average global temperatures for each of two periods (1880 -1944) and (1944 to 1998) and is critically important to showing whether CO2 influenced the temperature based solely on empirical evidence.
Figure 2 – Warming trend in central England since 1659 vs. annual CO2 human source emissions – source Hadley Centre England
So if we look at the human source CO2 emission rate and absolute quantity of emissions at the beginning and end of each of the definable (warming and cooling) periods on the global temperature record one can note whether or not there is a correlation of CO2 increases to global warming increases. This turns out to be very easy. By inspection it can be seen that there was both a global temperature “cooling” period and “warming” period in each of the two time spans that had a relatively rate of increase in human source CO2 emissions. Thus, it is immediately clear, based on these data that there is not a direct correlation of human source CO2 rise and global temperature rise. To reinforce this point let’s examine in detail the period 1944 to 1976.
By 1944 global human source CO2 emissions had increased to 5,000 MMT (Million Metric Tons) from about 2,000 MMT in 1880. Figure 2 shows that between 1944 and 1976 CO2 emissions increased to 20,000 MMT. So the earth started in 1944 with CO2 emissions at 5000 MMT and over the next 22 years CO2 emissions increased to 20,000 MMT. The global temperature at the end of that period (1976) was 0.37 deg. C lower than at the start of the period in 1944. So despite a quadrupling of annual human source CO2 emissions during the period 1944-1976 global temperatures cooled by 0.37 degrees from the 1944 global temperature value to the 1976 global temperature value. Figure 3 provides a corroborating reference on the rise in CO2 since 1800, and it provides an estimate of the contributors. The original data for the total shown is likely taken from the source shown in Figure 2.
In terms of absolute quantity of CO2 emissions, note that the average level of CO2 emissions over that 22 year period was 2.5 times the level of CO2 at the beginning of the period but there was no increase in global temperature during the period, in fact there was a net decrease.Juxtaposition of the rise of CO2 emissions and the global temperature change with time clearly shows that there is not a direct correlation in time between the two. This clearly contradicts the assertion of a direct correlation between CO2 emissions and global temperature rise, advanced and put forth by United Nations, promoted by the media and now pronounced by the President, and even the Pope. The confidence with which these latter, eminent proponents of cutting CO2 emissions is based on is the endorsement of the role of CO2 in global warming by the vast majority of scientists (as shown by polls). However, the above factual, unaltered and simple portrayal of easy to obtain empirical data clearly shows that (1) global warming is continuing but does so at an irregular pace and (2) that global warming is not significantly influenced by increases in human source CO2 emissions. The corollaries to this conclusion are that cutting CO2 emissions will likewise not have effect on reducing global warming and that other factors control global temperatures, just as they have for millennia. Thus, efforts and expenditures should be directed toward addressing the potential adverse effects of global warming and not on efforts and expenditures on trying to reduce CO2 emissions. Further, reduction in fossil fuel use should be based on cutting the true pollution they produce and the need and value of the development of alternative energy sources.
Those are the bare facts that are essential to understanding the truth about global warming. That brings us to the end of 101, but there is much more to learn. Tune in to Global Warming 102 to learn a few more key facts to help you discern the validity of the abundance of comments and opinions expressed about global warming and the role of CO2.